The first step is to read the documentation:
[root@localhost mythcat]# man journalctl
JOURNALCTL(1)                     journalctl                     JOURNALCTL(1)

NAME
       journalctl - Query the systemd journal

SYNOPSIS
       journalctl [OPTIONS...] [MATCHES...]

DESCRIPTION
       journalctl may be used to query the contents of the systemd(1) journal
       as written by systemd-journald.service(8).

       If called without parameters, it will show the full contents of the
       journal, starting with the oldest entry collected.

       If one or more match arguments are passed, the output is filtered
       accordingly. A match is in the format "FIELD=VALUE", e.g.
       "_SYSTEMD_UNIT=httpd.service", referring to the components of a
       structured journal entry. See systemd.journal-fields(7) for a list of
       well-known fields. If multiple matches are specified matching different
       fields, the log entries are filtered by both, i.e. the resulting output
       will show only entries matching all the specified matches of this kind.
       If two matches apply to the same field, then they are automatically
       matched as alternatives, i.e. the resulting output will show entries
       matching any of the specified matches for the same field. Finally, the
       character "+" may appear as a separate word between other terms on the
       command line. This causes all matches before and after to be combined
       in a disjunction (i.e. logical OR).
       ...
This helps you with free space into your Linux OS.
For example, I got 3 Gigabytes of data in just 3 days.
# journalctl --vacuum-time=3d- by time
journalctl --vacuum-time=2djournalctl --vacuum-size=500M[root@localhost mythcat]# cat /etc/systemd/journald.conf[root@localhost mythcat]# systemctl status systemd-journald
● systemd-journald.service - Journal Service
Loaded: loaded (/usr/lib/systemd/system/systemd-journald.service; static; vendor preset: disabled)
Active: active (running) since Tue 2017-03-28 09:12:20 EEST; 1h 8min ago
Docs: man:systemd-journald.service(8)
man:journald.conf(5)
Main PID: 803 (systemd-journal)
Status: "Processing requests..."
Tasks: 1 (limit: 4915)
CGroup: /system.slice/systemd-journald.service
└─803 /usr/lib/systemd/systemd-journald
Mar 28 09:12:20 localhost.localdomain systemd-journald[803]: Runtime journal (/run/log/journal/) is 8.0M,
max 371.5M, 363.5M free.
Mar 28 09:12:20 localhost.localdomain systemd-journald[803]: Journal started
Mar 28 09:12:22 localhost.localdomain systemd-journald[803]: System journal (/var/log/journal/) is 3.9G,
max 4.0G, 23.8M free.
Mar 28 09:12:23 localhost.localdomain systemd-journald[803]: Time spent on flushing to /var is 915.454ms
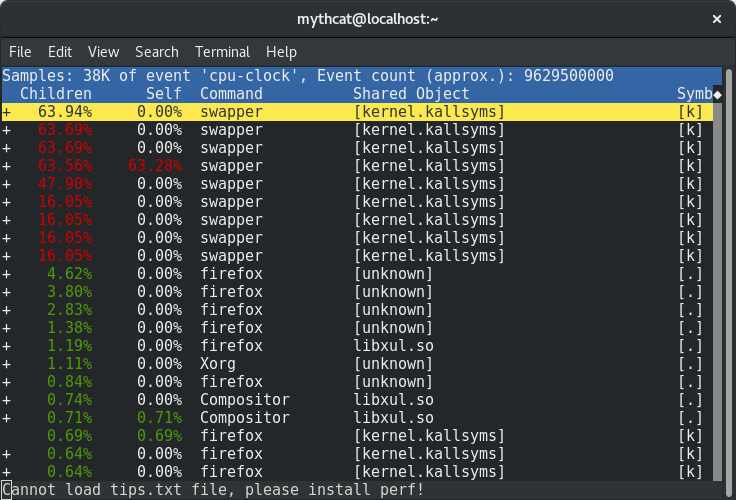 You can use the full list events by using this command:
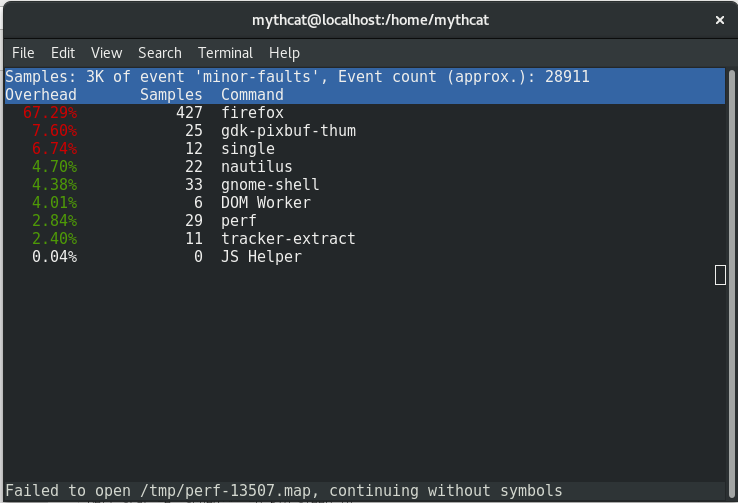 This is most simple way to see how is start and close some pids and how they interact in real-time with the operating system.
Another way to deal with the perf command is how to analyze most scheduler properties from within 'perf sched'
alone using the perf sched with the five sub-commands currently:
This is most simple way to see how is start and close some pids and how they interact in real-time with the operating system.
Another way to deal with the perf command is how to analyze most scheduler properties from within 'perf sched'
alone using the perf sched with the five sub-commands currently: