You can read a full tutorial from perf wiki and that will give a good impression on this utility.
The main problem come when you need to understand why we have to use this utility in linux.
Intro A trivial use the top command will show you the necessary information about your Linux.
If you look closely you will notice that :
load average: 0.09, 0.05, 0.01The three numbers represent averages over progressively longer periods of time (one, five, and fifteen minute averages). This means for us: that lower numbers are better and the higher numbers represent a problem or an overloaded machine. Now about multicore and multiprocessor the rule is simple: the total number of cores is what matters, regardless of how many physical processors those cores are spread across. Let's use this command: First I will record some data about my CPU:
[mythcat@localhost ~]$ perf record -e cpu-clock -ag
Error:
You may not have permission to collect system-wide stats.

Consider tweaking /proc/sys/kernel/perf_event_paranoid,
which controls use of the performance events system by
unprivileged users (without CAP_SYS_ADMIN).

The current value is 2:

  -1: Allow use of (almost) all events by all users
>= 0: Disallow raw tracepoint access by users without CAP_IOC_LOCK
>= 1: Disallow CPU event access by users without CAP_SYS_ADMIN
>= 2: Disallow kernel profiling by users without CAP_SYS_ADMIN
[mythcat@localhost ~]$ su
Password:
[root@localhost mythcat]# perf record -e cpu-clock -ag
^C[ perf record: Woken up 17 times to write data ]
[ perf record: Captured and wrote 5.409 MB perf.data (38518 samples) ]

[root@localhost mythcat]# ls -l perf.data
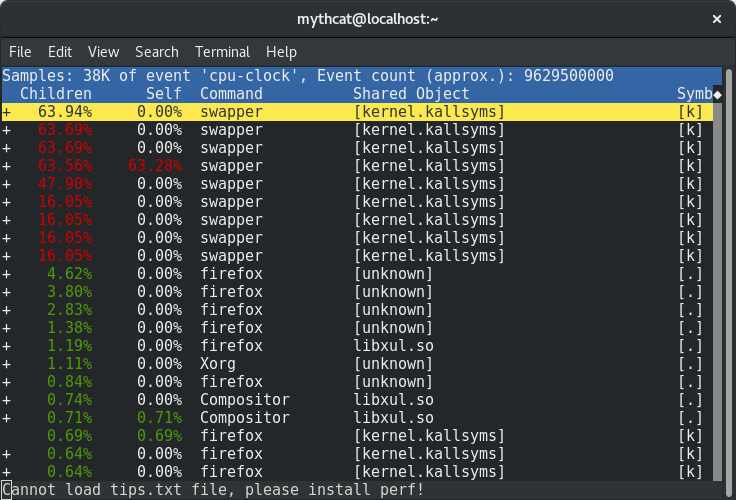
-rw-------. 1 mythcat mythcat 5683180 Feb 21 13:24 perf.data[mythcat@localhost ~]$ perf reportThe result of this command:
 You can use the full list events by using this command:
[mythcat@localhost ~]$ perf list

List of pre-defined events (to be used in -e):

  branch-instructions OR branches                    [Hardware event]
  branch-misses                                      [Hardware event]
  bus-cycles                                         [Hardware event]
  cache-misses                                       [Hardware event]
  cache-references                                   [Hardware event]
  cpu-cycles OR cycles                               [Hardware event]
  instructions                                       [Hardware event]
  ref-cycles                                         [Hardware event]

  alignment-faults                                   [Software event]
  bpf-output                                         [Software event]
  context-switches OR cs                             [Software event]
  cpu-clock                                          [Software event]
  cpu-migrations OR migrations                       [Software event]
  dummy                                              [Software event]
  emulation-faults                                   [Software event]
  major-faults                                       [Software event]
  minor-faults                                       [Software event]
  page-faults OR faults                              [Software event]
  task-clock                                         [Software event]
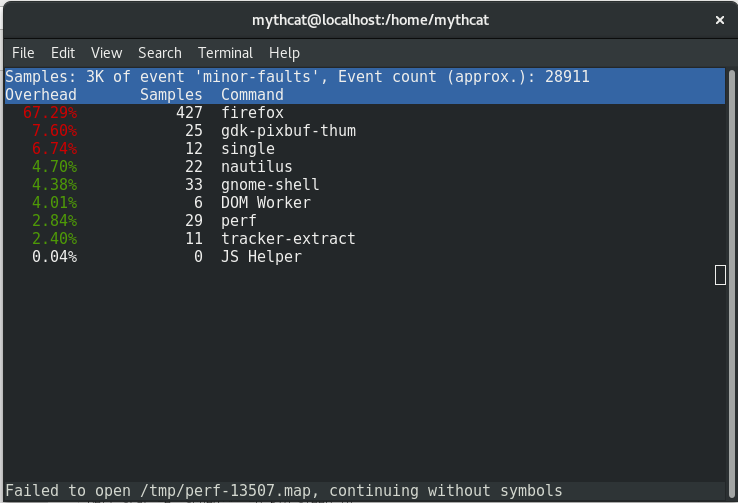
[root@localhost mythcat]# perf top -e minor-faults -ns comm This is most simple way to see how is start and close some pids and how they interact in real-time with the operating system.
Another way to deal with the perf command is how to analyze most scheduler properties from within 'perf sched'
alone using the perf sched with the five sub-commands currently:
perf sched record            # low-overhead recording of arbitrary workloads
perf sched latency           # output per task latency metrics
perf sched map               # show summary/map of context-switching
perf sched trace             # output finegrained trace
perf sched replay            # replay a captured workload using simlated threads
perf sched record sleep 10     # record full system activity for 10 seconds
perf sched latency --sort max # report latencies sorted by max [root@localhost mythcat]# perf sched record